10 000 comet connections
Q: How well does the Nginx HTTP push module perform with 10 000 concurrent clients? (Ye olde C10k problem).
A: Very well. About 7 kB per client and practically zero CPU load.
This article describes how I performed the test, using three different hosts – my local computer, a Debian Linux server and a Mac OS X host simulating 10 000 clients.
Disclaimer: This test is not intended as a realistic multi-channel test nor uses variable messages. In this test the broadcast mode is used, operating on a single channel. We also send a minimal message to avoid measuring buffer copy overhead. This test is set up to mimic how a real-world application I’m working on will operate – not necessarily your application.
Tuning the server
Per recommendation by Richard Jones the system limits and tcp memory was adjusted in /etc/sysctl.conf:
# General gigabit tuning:
net.core.rmem_max = 16777216
net.core.wmem_max = 16777216
net.ipv4.tcp_rmem = 4096 87380 16777216
net.ipv4.tcp_wmem = 4096 65536 16777216
# More memory for tcp:
net.ipv4.tcp_mem = 50576   64768   98152
net.core.netdev_max_backlog = 2500
And reloaded the configuration
sysctl -p
Nginx configured like this nginx.conf:
worker_processes  1;         #< single process since we do not need much CPU
daemon  off;                 #< so we can easily restart etc
error_log  nginx.log  info;  #< log stuff like connections closed
events {
	worker_connections  10010; #< 10000 (+10 spare) connection limit
}
http {
	sendfile           on;
	push_buffer_size  12M;
	push_queue_messages  off;
	server {
		listen   8088;
		location /msgq/post {
			set $push_id $arg_channel;
			push_sender;
		}
		location /msgq/listen {
			set $push_id $arg_channel; #/?channel=xyz or somesuch
			push_listener;
			push_listener_concurrency  broadcast;
		}
	}
}
Then started up nginx:
ulimit -n 999999
nginx -c nginx.conf -p /tmp
Tuning the client
The client host was a MacPro running OS X 10.5.
sudo su
ulimit -n 12000
sysctl -w kern.maxfiles=65536 kern.maxfilesperproc=32768
I did not make these changes permanent (i.e. did not add them to /etc/sysctl.conf).
Update: By explicitly specifying to set the soft limit, we can risen the FD limit beyond 12000 on OS X 10.5. e.g. ulimit -S -n 50000.
Running the test
httperf is a neat tool I use for some HTTP tests. However, because of a nasty limit in glibc
if (rlimit.rlim_max > FD_SETSIZE) {
	fprintf (stderr, "%s: warning: open file limit > FD_SETSIZE; "
		"limiting max. # of open files to FD_SETSIZE\n", prog_name);
	rlimit.rlim_max = FD_SETSIZE;
}
httperf cried
httperf --hog --server=hal --port=8088 --num-conns=10000 --rate=200 \
 --uri=/msgq/listen?channel=pb
httperf: warning: open file limit > FD_SETSIZE; limiting max.
 # of open files to FD_SETSIZE
So, unfortunately I couldn’t use httperf.
Instead, I wrote a modified version of the libevent-based http client by Richard.
I actually considered digging in to Tsung, but after scratching the surface I quickly realized it’s not really suited for what we’re trying to do here (testing a comet server).
During the test I observed the nginx worker process to see how much memory (VM and residential) consumed. Note that these numbers are for active connections in the nginx_http_push module. A regular request in nginx should use slightly less memory. This is the command I used to observe memory usage:
watch -n 1 'cat /proc/821/status | grep -E "Vm(RSS|Size)"'
Before we begin, when there are no (zero) active connections in the server, thes is the base memory usage:
VmSize:    41176 kB
VmRSS:      4624 kB
Now, starting the c10k-test-client.c:
$ ./c10k-test-client 10000 217.213.5.37 8088 '/msgq/listen?channel=pb'
Making 10000 connections to http://217.213.5.37:8088/msgq/listen?channel=pb
100 requests sent (100 connected)
200 requests sent (200 connected)
...
9900 requests sent (9900 connected)
10000 requests sent (10000 connected)
All 10000 requests sent (10000 connected).
# --- Here I send a message ---
All connections are closed.
connections: 10000	Bytes: 50000	Chunks: 10000	Closed: 10000
Completed: 10000	Failed: 0
Max concurrency: 10000
Where it says "# --- Here I send a message ---" I used curl on my local computer to post a message to all 10 000 listeners:
curl -id 'hello' http://hal.hunch.se:8088/msgq/post?channel=pb
Now, lets look at memory consumption again (this was sampled before we posted the message) with 10 000 active connections:
VmSize:   109288 kB (6.8 kB/conn)
VmRSS:     73216 kB (6.8 kB/conn)
 6.8 kB per connection – Not bad. Not bad at all. And it took about 100ms in total to send the message to all 10 000 clients.
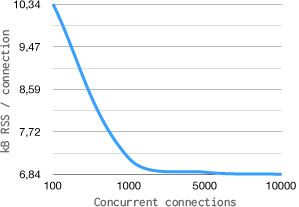
To get a better idea of the memory-per-connection ratio (N kB/conn), let’s look at how much memory is used for 100, 1000 and 5000 connections.
| Conns. | VM size | RSS | kB/conn. |
|---|---|---|---|
| 100 | 41812 | 5828 | 10.34 |
| 1000 | 48016 | 11960 | 7.17 |
| 5000 | 75208 | 39212 | 6.88 |
| 10000 | 109288 | 73216 | 6.84 |
The above numbers where obtained by repeating the test with “Conns.” number of concurrent connections.
Conclusion
My conclusion is that 1 active connection requires about 7 kB memory (on a 64bit system). Note that memory usage is not linear and the more connections the “less” memory per connection. This is most likely due to how the nginx memory management handles things (slab allocations).
Notes
Base readings: When no connections are active in the nginx_http_push module, there are also no channels or message queues allocated. One channel plus module context occupies 170 kB, and as our test implicitly operates on a single channel, 170 kB was added to the residential memory base reading when calculating the “(N kB/conn)” values.
Hard FD limit in OS X: Due to OS X not accepting a FD limit of more than 12000 (effectively slightly less) I was unable to run the test with more connections. Another day I might use a Linux host for the client part and perform more tests. Update: By explicitly specifying to set the soft limit, we can risen the FD limit beyond 12000 on OS X 10.5. e.g. ulimit -S -n 50000.
Other resource usage? I intentionally left out other resources observed during the test, like CPU and context switches. Load stayed at 0.00 during all tests and we only used a single process without any additional threads.